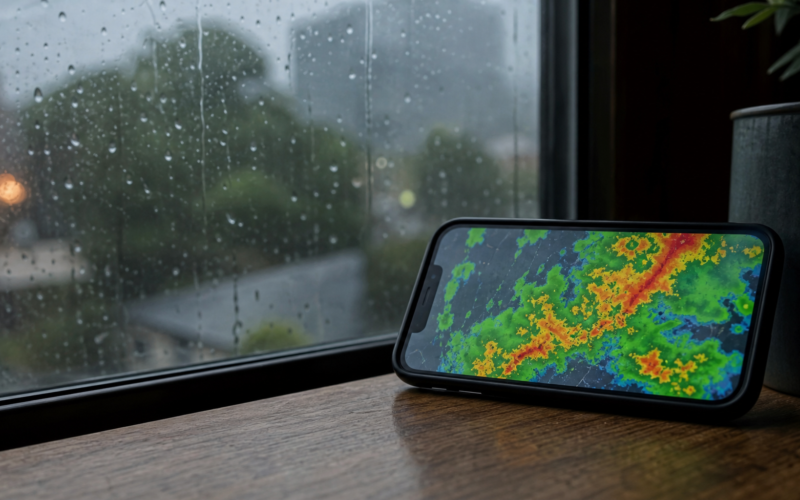

The friendly weather segment on the morning news looks simple. A cheerful presenter waves at a colorful map, tosses out a high temperature, and moves on. But behind that easy delivery sits a genuinely impressive amount of science. Modern forecasting is one of the great quiet achievements of the past century, and understanding what those numbers and symbols actually mean turns a background segment into something genuinely useful for planning your day.
What the Percentages Really Mean
The most misunderstood number is the chance of rain. A forty percent chance does not mean it will rain forty percent of the day, nor that forty percent of your town will get wet. It generally reflects the forecaster’s confidence that measurable rain will fall somewhere in the area during the period. Once you read it as a confidence level rather than a promise, those percentages become far more useful for deciding whether to carry an umbrella.
Why Feels Like Differs From the Actual Temperature
You will often hear two temperatures, the actual reading and what it feels like. That second number accounts for humidity in summer and wind in winter, both of which change how your body experiences the air. High humidity makes heat feel more oppressive because sweat evaporates slowly, while wind strips warmth away and makes cold bite harder. The feels like number is often the more practical one for deciding how to dress before you head out.
How Forecasters See the Future
Forecasts come from enormous computer models that crunch data from satellites, weather balloons, and thousands of ground stations. These models simulate the atmosphere and project it forward in time. Human forecasters then interpret the results, adding local knowledge the models miss. This is why a good forecaster is part scientist and part experienced guide, translating a flood of data into a simple, actionable picture for the rest of us.
Why Forecasts Get Less Certain Over Time
A one day forecast is usually quite reliable, but a seven day outlook is more of an educated guess. The atmosphere is chaotic, meaning small differences today can lead to big differences a week from now. That is why the far end of a ten day forecast should be treated as a rough sketch that will keep changing. Checking again as the day approaches is not the forecaster being wishy washy. It is simply how the science works.
Frequently Asked Questions
What does a chance of rain percentage actually mean? It reflects the forecaster’s confidence that measurable rain will fall in the area during the period, not how long it will rain or how much of the region gets wet.
Why is the feels like temperature different? It factors in humidity and wind, which change how your body senses the air. That is why it is often the more useful number when deciding what to wear.
How far ahead can forecasts be trusted? A day or two out is usually quite reliable. Beyond about a week, forecasts become rough guides that shift as the date nears, so it helps to check again closer to the time.
Why do forecasts sometimes get it wrong? The atmosphere is chaotic, so tiny uncertainties grow over time. Forecasting has improved dramatically, but perfect prediction of a complex system is simply not possible.
Are weather apps as good as a TV forecaster? Apps pull from the same models and are great for quick checks. A skilled local forecaster can still add context and catch local quirks that a generic app might miss.
Related reading: For more on this, take a look at our guide to becoming your household’s weather expert.
The Bottom Line
That breezy weather segment is the tip of a remarkable scientific iceberg. Once you understand what the percentages, the feels like numbers, and the shrinking certainty over time actually mean, the forecast stops being background noise and becomes a genuinely useful tool. A little literacy about the weather rewards you every single day, turning a familiar habit into smarter, more confident planning.